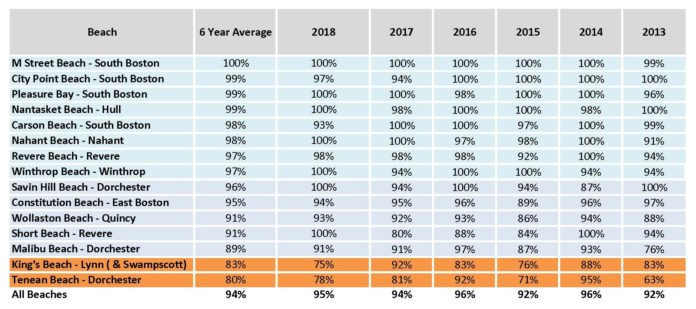
On Sunday, May 26, 2019, the environmental advocacy organization Save the Harbor/Save the Bay released their annual Metropolitan Beaches Water Quality Report Card, just in time for Memorial Day.
In 2018, weekly water quality testing at Boston’s regional beaches began May 24th. Supplemental daily testing of Constitution Beach, King’s Beach, Malibu Beach, Tenean Beach, and Wollaston Beach began on June 7th, 2018. Testing concluded on Labor Day weekend, September 3, 2018.
These scores reflect the percent of samples that complied with the Massachusetts Department of Public Health’s single sample limit for bacteria which is the most straightforward way of evaluating beach water quality and potential impacts on human health.
In 2018, the overall water quality safety rating for Boston Harbor’s regional beaches was 95%, a slight improvement over the 2017 score of 94%.
M Street Beach in South Boston topped the list again this year, while Tenean Beach in Dorchester and King’s Beach in Lynn and Swampscott were the lowest-scoring beaches in the region again in 2018.
It is important to note that the Boston Water and Sewer Commission continues to identify and address illicit connections that contribute to the problems at Tenean Beach in Dorchester, while both Lynn and Swampscott have planned improvements to their sewer and storm water systems, which we expect will result in improvement in water quality on King’s Beach upon completion.
Though 2018 was the wettest year on record for Massachusetts, with 61 inches of rain, more than 16 inches above the 20th century average and the total rainfall during the 2018 sampling season was very similar to 2017, though more than double than in 2016.
There were several large rain events during the 2018 swimming season, three of which were greater than 1 inch – they were 1.16, 2.68, and 1.38 inches respectively. While the average daily rainfall for the summer was 0.12 inches, more than 42% of the rain came in just three storms. This may indicate that the distribution, frequency, and intensity of summer storms that seemed somewhat atypical, may be increasingly common in the future.
Changes in the intensity and frequency of summer storms often explains the variations we see on our beaches from year to year. These seasonal variations are why Save the Harbor/Save the Bay is reluctant to draw conclusions from a single year’s sampling results, preferring to rely on the six-year average we have included in this report.
One critical weakness of our beach posting and flagging program, where bacteria testing triggers advisories, is that postings are always a day late because beach managers must wait 24 to 36 hours after a sample is collected to obtain test results. Beach water quality may have already changed significantly during this period, and the prior day’s test does not necessarily reflect current conditions.
Instead of relying on postings and flags, we urge beach goers to rely on common sense and the six-year average for their beach, though we understand why it’s interesting to see where water quality improved or declined versus the previous year.
BEACH WATER QUALITY EVALUATION METHODS AND METRICS
Save the Harbor uses quantitative metrics for assessing beach water quality and management at the Boston Harbor region beaches. Enterococcusis the current microbial indicator of GI illness used in marine waters, as established by EPA guidelines. To assess and compare the water quality and conditions on each beach, we looked at the percentage of test samples exceeding the state swimming standard of 104 colony forming units (cfu) of Enterococcus in 100 milliliters (mL) of water.
Another indicator of water quality is the geometric mean (GM). The GM indicates the central tendency of a set of numbers from the product of their values and is a useful measure when values can increase exponentially, like bacteria counts. Massachusetts Department of Health requires DCR to calculate the GM based on bacterial exceedance values from the previous five days without rain. A GM of 35 cfu/100 ml or greater is the threshold used to indicate increased public health risk by EPA and will cause a beach to be flagged with a swimming advisory.
Beaches have varying number of sampling locations, depending on beach size; some have only one location whereas others have as many as four. The frequency that beaches are sampled and tested for bacteria also varies by beach, with some tested weekly and others tested daily during the swimming season. These variations in testing frequency and number of sampling sites affect how beach safety is calculated.
The “Primary Beach Safety” measure provided in this report calculates the percent of samples at each beach that comply with the single sample bacteria limit for swimming. It provides a straightforward method to compare water quality at Boston Harbor beaches. However, this measure does not always correspond directly with the percent of time that a beach is actually posted with swimming advisory due to precautionary postings after rain events, or failure to comply with the multi-day geometric mean limit described above.
Using water quality data from the 2018 season and the previous six years, Save the Harbor/Save the Bay has compiled this report to help the region’s residents and visitors make informed decisions about where and when to swim.


